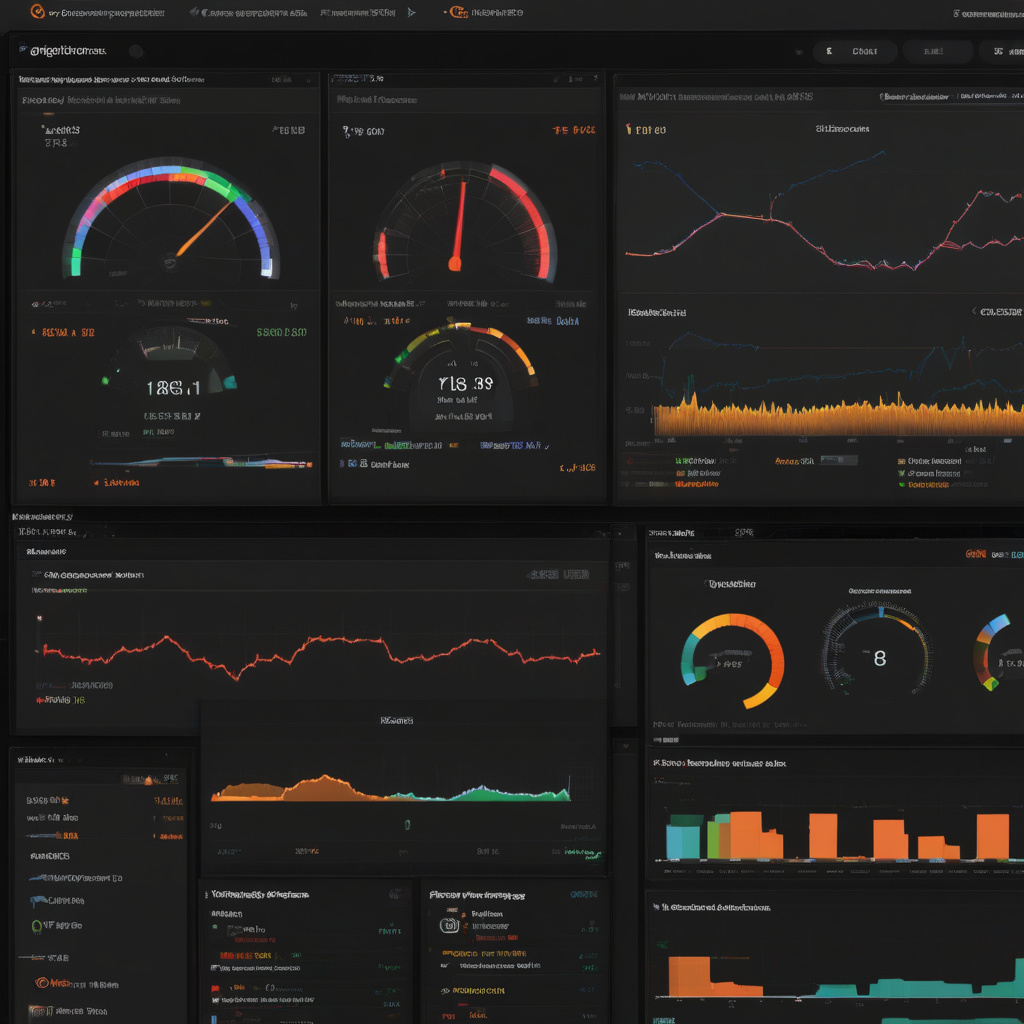
Grafana, the popular open-source analytics platform, has recently unveiled its latest version, 12.1, packed with a host of new features tailored to enhance user experience. With a focus on improving diagnostics and alerting capabilities, Grafana 12.1 is set to revolutionize how developers monitor and analyze their systems.
One of the most exciting additions in Grafana 12.1 is the introduction of built-in diagnostics. This feature allows users to easily troubleshoot performance issues within the platform itself, streamlining the debugging process and saving valuable time. By providing in-depth insights into system metrics and performance data, Grafana empowers developers to identify and resolve issues efficiently.
Moreover, Grafana 12.1 brings significant enhancements to its alerting functionality. Building on its existing capabilities, the new version offers more flexibility and customization options for setting up alerts based on specific criteria. From threshold-based alerts to anomaly detection, Grafana now provides users with a comprehensive toolkit to proactively monitor their systems and take timely action when anomalies occur.
The improved alerting system in Grafana 12.1 enables users to create sophisticated alert rules that align with their unique monitoring requirements. Whether it’s setting up alerts for CPU usage spikes, memory leaks, or service disruptions, Grafana offers a versatile solution to keep developers informed about the health and performance of their systems in real-time.
Additionally, Grafana 12.1 introduces a user-friendly interface that simplifies the alerting configuration process. With intuitive workflows and interactive dashboards, users can easily create, manage, and visualize alerts without the need for complex setups. This streamlined approach enhances usability and ensures that developers can leverage Grafana’s alerting capabilities effectively.
In conclusion, Grafana 12.1 represents a significant milestone in the evolution of the platform, with its focus on built-in diagnostics and enhanced alerting functionalities. By equipping users with powerful tools to monitor, analyze, and respond to system events, Grafana continues to solidify its position as a leading analytics solution for IT and development professionals.
As developers embrace Grafana 12.1’s new features, they can expect to achieve greater visibility into their systems, improved troubleshooting capabilities, and enhanced alerting mechanisms—all of which are essential for maintaining the performance and reliability of modern applications in today’s dynamic IT landscape.

